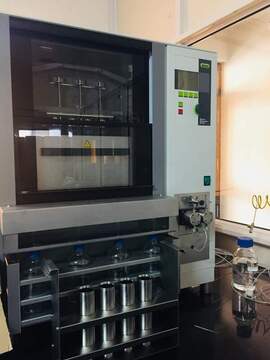
BUCHI-E914 Speed Extractor
|
Silica gel Column Chromatography |
|
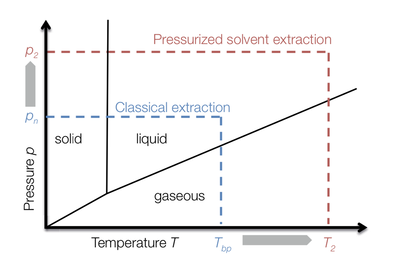
BUCHI is an automated parallel extraction machine using 4 cells at once.
ASE-350 only uses 1 cell and is sequence based instrument. Both the instruments are used to extract organic compounds from solid and semisolid matrices with the help of organic solvents. Increased temperature accelerates the extraction kinetics, and elevated pressure keeps the solvent liquid above its boiling point, ensuring safe, rapid extractions. Credit: BUCHI |
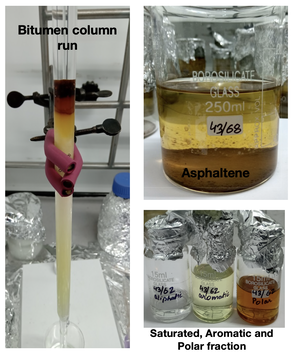
Total Lipid extract/Bitumen is fractionated to three groups of compounds with the help of Silica-gel Column Chromatography.
1. Apolar fraction (alkane, acyclic isoprenoids and cyclic isoprenoids (terpenoids). 2. Aromatic Hydrocarbons 3. Polar fraction PIC: late Permian - Early Triassic sample extract |
|
|
|
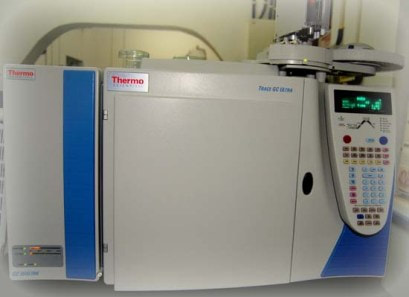
GC-MS, GC-TQ(MS-MS) and GC-C-IRMS |
Molecular Sieve |
|
The different classes of compounds are analyzed with the help of gas-chromatography (GC) technique coupled to mass spectrometers (MS).
GC helps to separate the different compounds having different chemical nature depending on their volatility and affinity for the chemical coating inside capillary column. The MS component connected to GC is a technique to characterize the compound of interest. The molecule/compound is fragmented by the electron ionization (EI-70eV) an fragmentation pattern and diagnostic ions are further analyzed to identify the compound of interest. In order to determine the isotopic composition of individual compounds, Isotope Ratio Mass Spectrometer is coupled to the Gas Chromatograph peripheral. 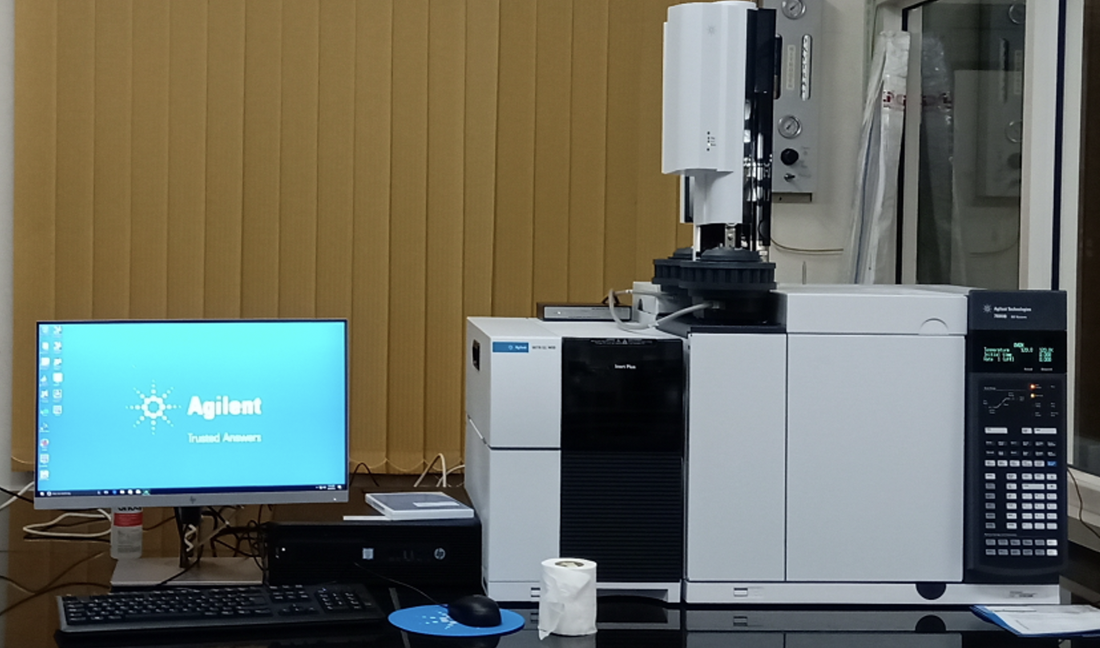
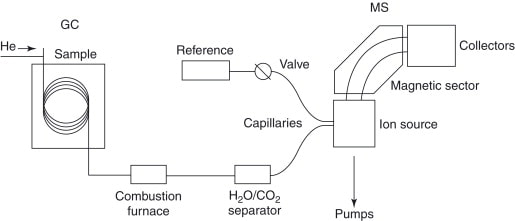
|
The carbon and hydrogen isotopic composition of n-alkanes and cyclic isoprenoids can be analyzed using gas chromatography–isotopic ratio mass spectroscopy (GC-IRMS). Before doing so, the alkanes are separated from the apolar fraction using 5 Å zeolite molecular sieve in cyclohexane. The sieve is further digested in HF to release the alkanes. The alkane are again extracted using hexane. The same technique can be used to analyze the isotopic signatures of terpenoids present in the apolar/saturated fraction.
The separation of cyclic and aliphatic hydrocarbons can also be achieved using urea adduction method. Malvern Particle Size Analyzer 3000EMastersizer 3000 delivers measurements from 10 nm to 3.5 mm using a single optical measurement path, making it suitable for an extremely wide range of applications. Dispersed sample passes though the measurement area of the optical bench, where a laser beam illuminates the particles. A series of detectors then accurately measures the intensity of light scattered by the particles within the sample for both red and blue light wavelengths and over a wide range of angles.
Source: Malvern 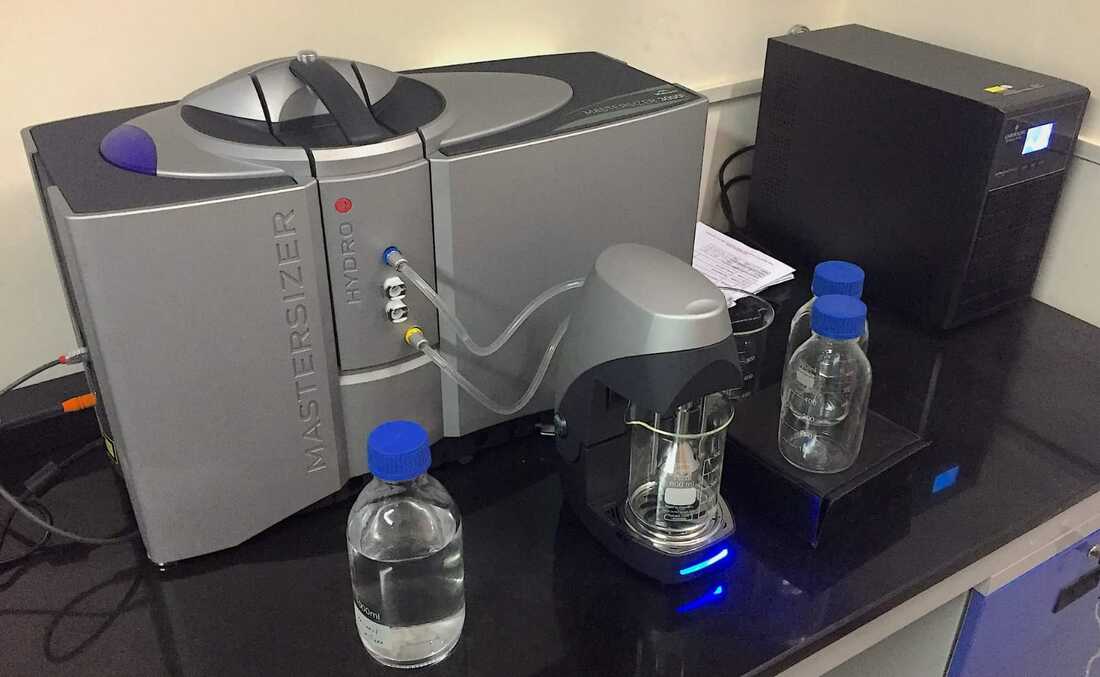
Amino Acids AnalysisThe amino acid (AA) analysis of the sediment samples are carried out on a Biochrom 30 Amino Acid Analyser. 18 AA monomers as well as the 2 hexosamines (HA) glucosamine (Gluam) and galactosamine (Galam) can be analyzed and quantified. The standard mixture of AAs with known concentration (SIGMA AA-S-18) with the addition of cysteic acid (CYA), taurine (TAU), methionine sulfoxide (MSO), β-alanine (β-Ala), γ-aminobutyric acid (γ-Aba), tryptophan (TRP), ornithine (ORN), Gluam and Galam is used for the quantification of all AA and HA molar concentrations.
The same can also be analyzed with the help of GC-MS after the derivatization process. A commercially available derivatizing agent BSTFA (with 1%TMCS) N,O-Bis(trimethylsilyl)trifluoroacetamide is used to derivatize the Amino Acids. |
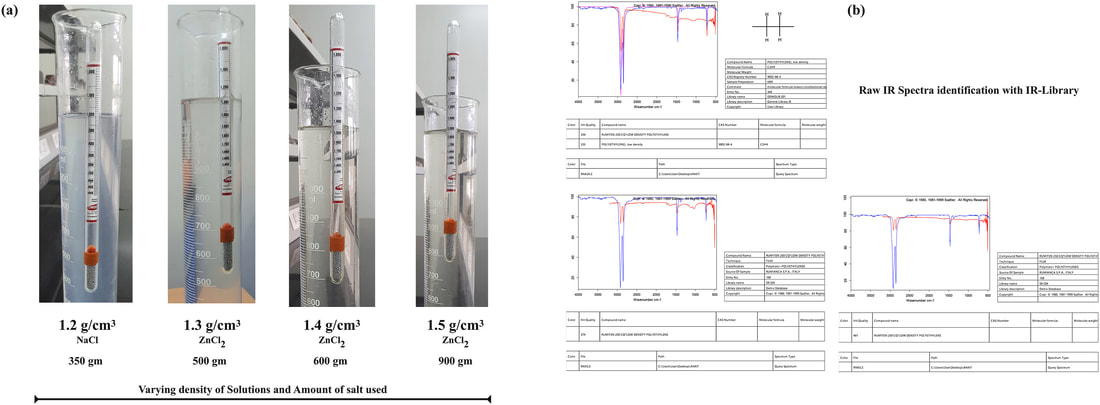
Microplastics Analysis
https://www.sciencedirect.com/science/article/pii/S0045653521016040
Mass Spectral Analysis
MassHunter Qualitative Analysis is feature-rich mass spec screening software for the confirmation of target or suspect compounds, and for the identification of unknown analytes. The software is part of the MassHunter suite, which supports a wide range of mass spec identification analyses. A single, consistent user interface across all Agilent mass spec platforms minimizes training requirements and reduces operator errors.
Advanced data mining and processing options let you rapidly and accurately find all detectable compounds and easily confirm targets or identify unknowns. Results can be displayed using fast, flexible data reporting with either preconfigured reports that simplify basic analyses, or completely customized PDF reports.
Source- https://www.agilent.com/en/product/software-informatics/mass-spectrometry-software/data-analysis/qualitative-analysis
Surfer is a grid-based mapping program that interpolates irregularly spaced XYZ data into a regularly spaced grid. Grids may also be imported from other sources, such as the United States Geological Survey (USGS). The grid is used to produce different types of maps including contour, color relief, and 3D surface maps among others. Many gridding and mapping options are available allowing you to produce the map that best represents your data.
Gridding methods include:
Source: Golden Software
Gridding methods include:
- Kriging
- Natural Neighbor
- Nearest Neighbor
- Polynomial Regression
- Moving Average
- Data Metrics
- Local Polynomial
Source: Golden Software
With Grapher, creating a graph is as easy as choosing the graph type, selecting the data file, and clicking the Open button. Grapher automatically selects reasonable default settings for each new graph, though all of the graph settings can be modified. For example, you can change tick mark spacing, tick labels, axis labels, axis length, grid lines, line colors, symbol styles, and more.
Usage: Plots (Scatter, Ternary, Piper, Histograms, Regression, Correlation and etc.), Chart (Rose, Pie, Radar and etc.) and Contouring.
Source: Golden Software
Usage: Plots (Scatter, Ternary, Piper, Histograms, Regression, Correlation and etc.), Chart (Rose, Pie, Radar and etc.) and Contouring.
Source: Golden Software
The XLSTAT interface totally relies on Microsoft Excel, whether for inputting the data or for displaying the results. The Univariate plots, contingency tables, component analysis, correspondence analysis, multidimensional scaling and other parametric tests are some of the in-built features of the XLSTAT.
PAST is a comprehensive statistics package used in many fields of life science, earth science, engineering and economics. It is free of cost and easy to use software.
The ArcMap represents geographic information as a collection of layers and other elements in a map view. There are two primary map views in ArcMap: the data view and the layout view. The data frame provides a geographic window, or map frame, in which you can display and work with geographic information as a series of map layers. The layout view provides a page view where map elements (such as the data frame, a scale bar, and a map title) are arranged on a page for map printing.
Usage: Classification schemes, Georeferencing, Spatial analysis, Ground-truthing validation and etc.
Usage: Classification schemes, Georeferencing, Spatial analysis, Ground-truthing validation and etc.
MATLAB, Climate Data Operators (CDO) and Ncview
NetCDF (Network Common Data Form) is designed to facilitate access to array-oriented scientific data. NetCDF is a portable, "self-describing" format. This means that there is a header which describes the layout of the rest of the file, in particular the data arrays, as well as arbitrary file metadata in the form of name/value attributes. NetCDF is the format most commonly used for climate model generated data.
In order to manipulate and analyze climate data, command line operators (Climate Data Operators) and MATLAB based scripts are used.
Usage: Climate data visualization and analysis and Model data analysis.
Source: Ncview, UNIDATA, MATLAB and CDO
